
As a newcomer to digital marketing, you’ve likely realized that data is at the heart of everything we do. The sheer volume of information available can be overwhelming, and it’s easy to feel lost in a sea of numbers, charts, and graphs. You’re not alone in feeling that everything seems important – it’s a common challenge for beginners. The ability to shift through this massive database and extract meaningful insights is indeed a valuable skill.
Let’s break down this complex topic and help you find your footing in the world of digital marketing data.
Understanding the Purpose of Your Report
Before you start gathering data or making charts, it’s crucial to understand why you’re creating this report. A digital marketing report serves several key purposes:
- It tracks the performance of your marketing efforts
- It helps identify what’s working and what isn’t
- It guides future marketing decisions
- It demonstrates the value of your work to clients or superiors
Take a moment to write down the specific purpose of your report. Are you showcasing the results of a particular campaign? Providing a monthly overview of all marketing activities? Your purpose will guide every other decision you make about your report.
Defining Your Audience
Next, consider who will be reading your report. Your audience significantly impacts how you present information. Common audiences include:
- Clients: They want to see the value they’re getting for their money
- Your boss: They’re interested in overall performance and ROI
- Your team: They need detailed insights to improve their work
For each potential reader, write down what they care about most. This will help you tailor your report to their needs.
Choosing Your Metrics
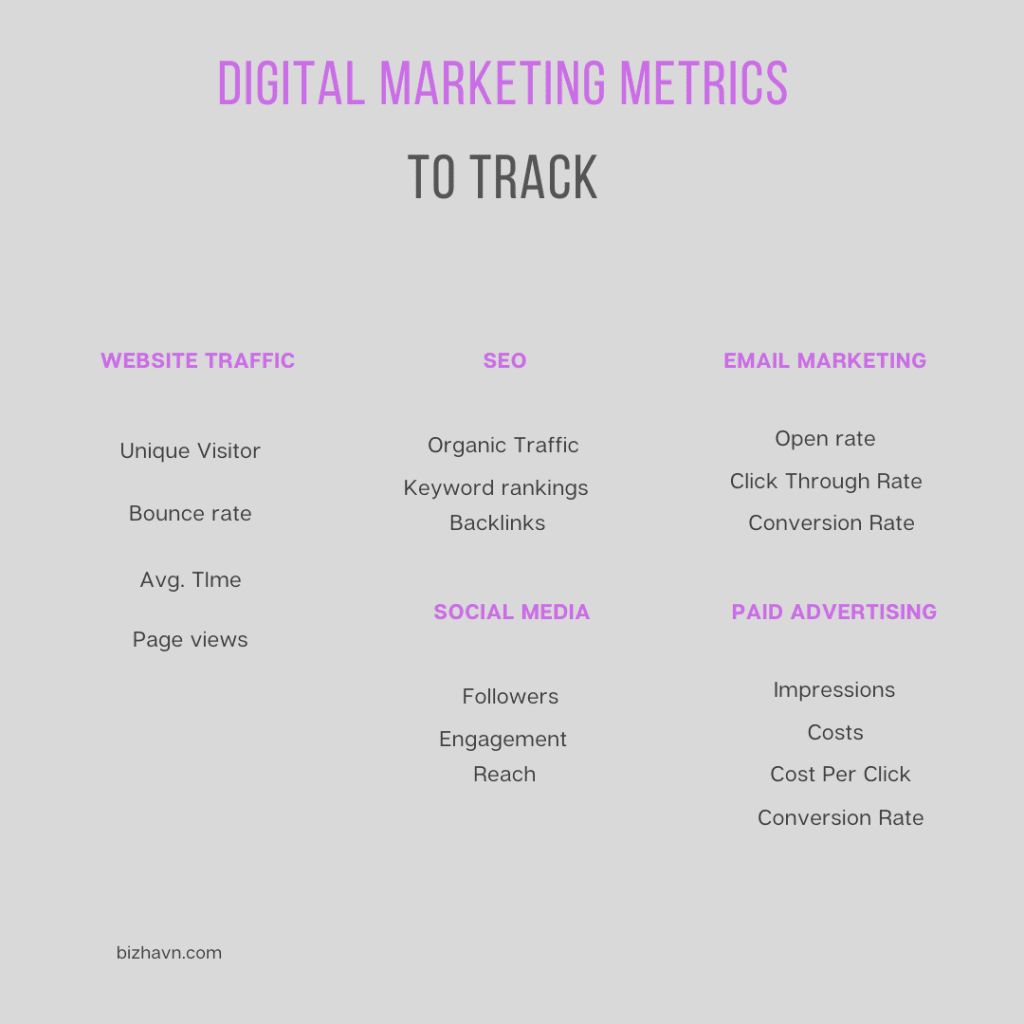
Now comes a crucial step: deciding what to measure. As a beginner, it’s easy to get overwhelmed by the sheer number of metrics available. Here’s a breakdown of essential metrics for different aspects of digital marketing:
Website Traffic:
- Unique visitors: The number of individual people who visited your site
- Pageviews: Total number of pages viewed
- Average time on site: How long visitors typically stay on your site
- Bounce rate: Percentage of visitors who leave after viewing only one page
Why these matter: These metrics give you a basic understanding of how many people are coming to your site and how they’re interacting with it.
SEO:
- Organic traffic: Visitors who come to your site from search engines
- Keyword rankings: Where your site appears in search results for specific terms
- Backlinks: How many other websites link to yours
Why these matter: SEO metrics show how visible your site is in search engines and how well you’re attracting organic traffic.
Social Media:
- Followers: Total number of people following your accounts
- Engagement rate: How often your followers interact with your posts
- Reach: How many people see your posts
Why these matter: These metrics indicate how well you’re building and engaging with your audience on social platforms.
Email Marketing:
- Open rate: Percentage of recipients who open your emails
- Click-through rate: Percentage of recipients who click on links in your emails
- Conversion rate: Percentage of recipients who take a desired action (like making a purchase)
Why these matter: Email metrics show how effective your email campaigns are at engaging subscribers and driving actions.
Paid Advertising:
- Impressions: How many times your ads were shown
- Clicks: How many times your ads were clicked
- Cost per click (CPC): Average cost for each click on your ad
- Conversion rate: Percentage of ad clicks that result in a desired action
Why these matter: These metrics help you understand the performance and cost-effectiveness of your paid advertising efforts. For your first report, don’t try to include every possible metric. Choose 2-3 from each category that align best with your report’s purpose and audience.
Gathering Your Data
Now that you know what you want to measure, it’s time to collect the data.
Here’s where to find the metrics we discussed:
Google Analytics: This free tool is your go-to source for website traffic data.
Here’s how to access key metrics:
a. Log into Google Analytics
b. In the left sidebar, click on “Audience” > “Overview” for general traffic metrics
c. For more detailed data, explore the other options under “Audience,” “Acquisition,” and “Behavior”
SEO tools: While some SEO data is available in Google Analytics, tools like SEMrush or Ahrefs provide more comprehensive information. Many offer free trials, which can be useful for your first report.
Social Media Platforms: Each platform has its analytics section:
- Facebook: Use Facebook Insights
- Twitter: Use Twitter Analytics
- Instagram: Use Instagram Insights
- LinkedIn: Use LinkedIn Analytics
Email Marketing Platform: If you use a service like Mailchimp or Constant Contact, they have built-in analytics sections where you can find your email metrics.
Ad Platforms: For paid advertising metrics, go to the platform where you’re running ads (like Google Ads or Facebook Ads Manager) and look for their reporting or analytics section.
Pro Tip: Set a specific time frame for your data collection (e.g., the past 30 days or the previous month) and use the same time frame across all platforms for consistency.
Organizing Your Data
Once you’ve gathered your data, it’s time to organize it.
Here’s a step-by-step process:
a. Create a new spreadsheet (Google Sheets or Excel)
b. Make separate tabs for each marketing channel (Website, SEO, Social Media, Email, Paid Ads)
c. In each tab, create columns for:
- Metric Name
- Current Period Value
- Previous Period Value
- Percent Change
d. Fill in your data, calculating percent change where applicable
This organization will make it easier to spot trends and create visualizations later.
Analyzing Your Data
Now comes the crucial part: making sense of all these numbers.
Here’s how to approach your analysis:
a. Look for significant changes: Any metric that has changed by more than 10% (up or down) is worth investigating.
b. Compare different metrics: For example, if your website traffic went up but your conversion rate went down, that could indicate a problem with your site’s content or user experience.
c. Consider external factors: Did you run any special promotions? Were there holidays or events that might have affected your metrics?
d. Look for patterns: Are certain days of the week or times of the month consistently better or worse?
For each significant observation, write down:
- What happened?
- Why do you think it happened?
- What does this mean for your marketing efforts?
Creating Visualizations
Visual representations of data can make your report much more engaging and easier to understand.
Here’s how to create basic but effective charts: In your spreadsheet program:
a. Highlight the data you want to visualize
b. Click on “Insert” > “Chart”
c. Choose the appropriate chart type:
- Bar charts are great for comparisons
- Line charts work well for showing trends over time
- Pie charts can illustrate proportions (like traffic sources)
Pro Tip: Keep your charts simple. It’s better to have several simple charts than one complicated one.
Structuring Your Report
Now it’s time to put everything together. Here’s a suggested structure for your report, make it in Powerpoint or Canva (or any report making software)
a. Executive Summary: A brief overview of key findings (1-2 paragraphs)
b. Website Performance:
- Traffic Overview
- Top performing pages
- User behavior insights
c. SEO Performance:
- Organic traffic trends
- Top performing keywords
- Backlink growth
d. Social Media Performance:
- Follower growth
- Engagement rates
- Top performing posts
e. Email Marketing Performance:
- Open and click-through rates
- Top performing emails
- List growth
f. Paid Advertising Performance:
- Overall ad spend and results
- Best performing ads
- ROI analysis
g. Key Insights and Recommendations:
- 3-5 main takeaways from your data
- Specific, actionable recommendations for improvement
For each section, include:
- Relevant metrics (in text and visually)
- A brief explanation of what the data means
- Any notable trends or changes
Writing Your Report
When writing your report, remember these key points:
- Use clear, simple language. Avoid jargon unless you’re sure your audience will understand it.
- Explain what the data means, not just what it is. For example, don’t just say “Our bounce rate was 55%.” Say “Our bounce rate of 55% suggests that visitors aren’t finding what they need on our landing page.”
- Be honest about both successes and areas for improvement. A balanced report is more credible and useful.
- End each section with a brief “Key Takeaway” that summarizes the most important point.
Review
Before you send off your report:
- Proofread for any errors in data or text
- Ensure all charts and graphs are clearly labeled
- Check that your insights and recommendations align with the data you’ve presented
- If possible, have a colleague review it and provide feedback
Remember, your first report won’t be perfect, and that’s okay! Each report you create will be an opportunity to refine your skills and provide even better insights.
Conclusion
Creating a digital marketing report may seem daunting at first, but by following this guide, you’ll be able to create a comprehensive, insightful report that demonstrates the value of your marketing efforts.
As you become more comfortable with the process, you’ll be able to dive deeper into the data, uncover more nuanced insights, and make even more impactful recommendations.
Remember, the goal of your report is not just to present data, but to tell a story about your marketing efforts and guide future decisions.
With practice, you’ll become adept at crafting reports that not only inform but also drive real improvements in your digital marketing performance.